

")


- Messages : 4
- Remerciements reçus 0
How to show lon-Lat grid on Meltemus vector chart pack
- Dampfish
- Auteur du sujet
- Hors Ligne
- Nouveau membre
-

Moins
Plus d'informations
il y a 1 an 8 mois #2823
par Dampfish
How to show lon-Lat grid on Meltemus vector chart pack a été créé par Dampfish
Hi,
I've tried searching but failed to find an answer - is there a way to display a latitude-longitude grid over a vector chart ? The qtvlm documentation suggests there is a view menu option but I cannot find it. Show graticule is the closest I can find, but that doesn't seem to do anything.
Should the graticule work on vector charts?
Thanks
__PRESENT
Connexion ou Créer un compte pour participer à la conversation.
- maitai
- Hors Ligne
- Administrateur
-

Moins
Plus d'informations
- Messages : 1273
- Remerciements reçus 25
il y a 1 an 8 mois #2824
par maitai
Réponse de maitai sur le sujet How to show lon-Lat grid on Meltemus vector chart pack
Hello,
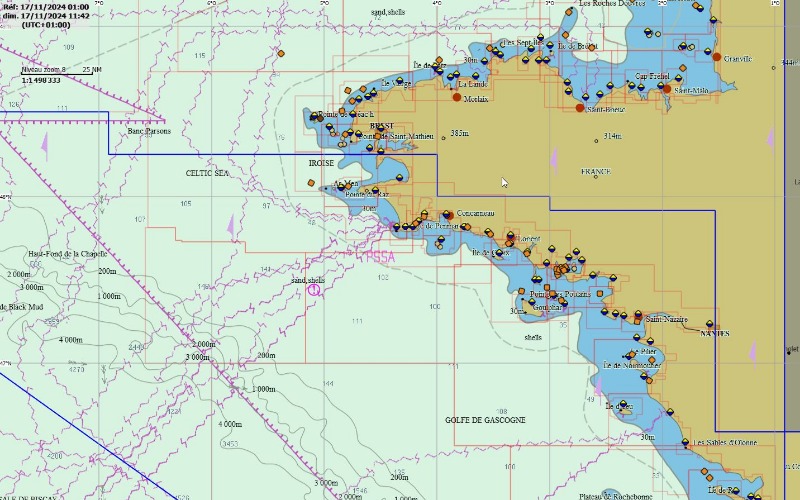
You are right, the graticule is what you are looking for. It shows here normally over the charts
You are right, the graticule is what you are looking for. It shows here normally over the charts
Connexion ou Créer un compte pour participer à la conversation.
- Dampfish
- Auteur du sujet
- Hors Ligne
- Nouveau membre
-
Moins
Plus d'informations
- Messages : 4
- Remerciements reçus 0
il y a 1 an 8 mois #2826
par Dampfish
Réponse de Dampfish sur le sujet How to show lon-Lat grid on Meltemus vector chart pack
Thanks maitai,
It doesn't work for me using the latest version of qtvlm for MAC but it does work for Windows.
Which would be fine but I only have a Windows VM and I can't install the charts on a Windows VM, sigh.
It doesn't work for me using the latest version of qtvlm for MAC but it does work for Windows.
Which would be fine but I only have a Windows VM and I can't install the charts on a Windows VM, sigh.
Connexion ou Créer un compte pour participer à la conversation.
- Dampfish
- Auteur du sujet
- Hors Ligne
- Nouveau membre
-
Moins
Plus d'informations
- Messages : 4
- Remerciements reçus 0
il y a 1 an 8 mois #2827
par Dampfish
Réponse de Dampfish sur le sujet How to show lon-Lat grid on Meltemus vector chart pack
I've realised the graticule does show up but the smallest grid is 1 degree and zooming in doesn't scale to show a 10 minute grid for example. In other words the graticule is just too course to show up unless you are really zoomed out.
I can see the screenshot you pasted also only shows a large scale graticule. Do you know if there is a way to show a minute level grid ?__PRESENT__PRESENT
I can see the screenshot you pasted also only shows a large scale graticule. Do you know if there is a way to show a minute level grid ?__PRESENT__PRESENT
Connexion ou Créer un compte pour participer à la conversation.
- maitai
- Hors Ligne
- Administrateur
-
Moins
Plus d'informations
- Messages : 1273
- Remerciements reçus 25
il y a 1 an 8 mois #2828
par maitai
Réponse de maitai sur le sujet How to show lon-Lat grid on Meltemus vector chart pack
There is no immediate way of doing that.
What you could do is create yourself an image with let's say 60 (or more) horizontal lines regularly spaced (with latitudes written on it) and similarly vertical lines for longitudes.
Then open Grib->Weather images, browse to your image, ask for a projection "Plate Carrée", specify top left corner coordinates of your image and latitude/longitude range, activate the image and press OK. This image will be reprojected into qtVlm projection and shown over the charts.
Connexion ou Créer un compte pour participer à la conversation.
Temps de génération de la page : 0.119 secondes